

HR reporting involves the collection and analysis of HR data in order to collect different HR metrics depending on the company’s objectives. This data is analyzed using simple descriptive statistics procedures or statistical association measures.
HR reporting includes all measures that serve to record information about the workforce and analyze it at regular intervals. All this happens at the push of a button, right? Exactly not! The reality is more like this:
- Many highly paid HR controllers sometimes despair of how much time they spend on operational HR reporting.
- They do not have time for higher quality analyses and discussions with management about insights and decision support based on analyzed HR data.
- The creation of HR reports is usually done on the basis of numerous Excel files; each time the “wheel is reinvented”. Revision security is missing!
Despite numerous books, seminars, practical experience and comprehensive software solutions, many managers sometimes make the situation outlined above difficult for themselves:
- For example, HR metrics and indicators are sometimes not derived from the corporate and HR strategy.
- HR-related standards are often not consistently incorporated into the selection of relevant HR metrics and reports.
- Analytic Process Automation is underestimated in terms of RoI and ease of use.
John Naisbitt, an American futurologist, once said: “We are drowning in information but starving for knowledge. In this article, I therefore focus on some success factors with regard to HR reporting.
Derivation from corporate and HR strategy
Strategy development affects a company on several levels: on the corporate level, the business unit level and the functional level – in our case HR.
In two articles – “Strategic courage in VUCA times” and “Strategic HR – also in execution” – I have already dealt intensively with the development of an HR strategy.
It is of central importance that this strategy is operationalized with the help of an HR scorecard, a Hoshin Kanri approach, or by means of OKR! Here, personnel-related standards as well as the Human Capability Framework developed by Dave Ulrich should be integrated.
Integration of personnel-related standards
The following illustration of the development of personnel-related key figures comes from Vanessa Sacco:
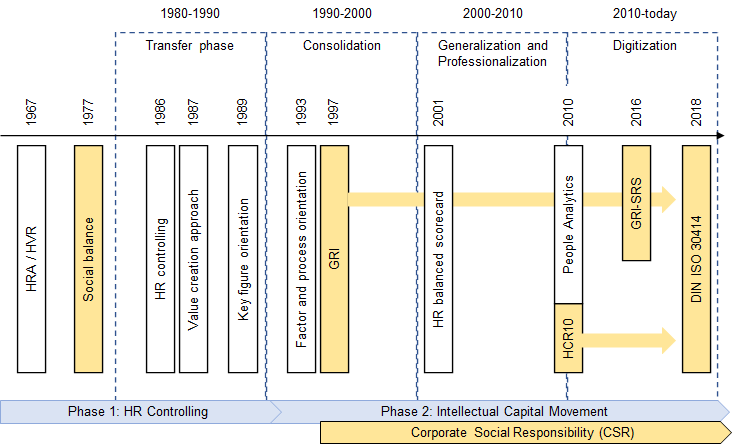
In two articles – “Sustainability: are you reporting yet?” and “Human Capital Reporting along DIN ISO 30414” (unfortunately only in German so far) – I have already discussed some of these standards.
The HCR10 provides a total of 73 indicators in seven reporting areas, 45 of which are declared as mandatory indicators and the remaining as optional indicators.
The latest version of the GRI-SRS (Sustainability Reporting Standards) is divided into 34 topic-specific standards, within which 89 indicators are defined. 31 of these are considered relevant to human resources.
DIN ISO 30414 comprises 58 indicators in eleven core areas. For external reporting, 20 indicators are considered suitable for large companies, whereas ten indicators are relevant for SMEs.
Analytic Process Automation
Companies of various industries and sizes are now using an Analytic Process Automation (APA) Platform™ to add insights and analytics to data and calculations. An APA Platform™ provides end-to-end automation of analytics, machine learning and data science processes. This enables a level of agility needed to accelerate digital transformation.
APA is neither Robotic Process Automation (RPA) nor Business Process Automation (BPA), nor is it a data tool. It is an automated self-service data analytics platform that focuses primarily on business outcomes while empowering everyone in the organization to adopt an analytics culture. It creates the foundation for performing high-quality analytics whether they know code or not – low-code/no-code capabilities – and whether they are trained in Data Science or not.
Conclusion
People analytics (PA) isn’t really possible without sophisticated HR reporting, but PA is more than just reporting. Both tools are used to share critical information that helps managers make better decisions.
Reporting and analytics have distinct differences. Reporting focuses on arranging and presenting facts, while Analytics provides actionable insights. However, both are important and interconnected.
Leave A Comment